
Routed review
Your pipeline assigns work to people and models, stage by stage. A gate sends it to review by the model's uncertainty score or a sampling rule, and reviewers see why each task reached their queue.
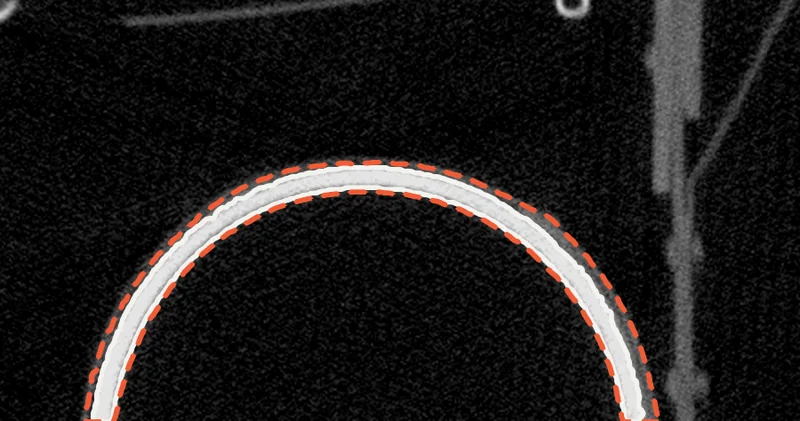
Four radiologists' published outlines of one nodule in white, and a SAM 2.1 proposal, dashed, run by Nitsor outside the product. Armato et al., "Data From LIDC-IDRI", TCIA, case LIDC-IDRI-0003, CC BY 3.0 (opens in a new tab), modified: windowed, cropped and outlined by Nitsor. Sources
No per-seat fees. Add annotators and reviewers without paying for each person.

What each frame shows
- Annotate, then Review
- Select a stage to see its settings
- A rejected review goes back to its annotator
Lay the pipeline out on one canvas.
Each stage is a box on the Pipeline tab. Select one to read its settings, including where rejected work goes back to.
The model's uncertainty per slice, 0 to 0.10
IoU with the published label, 0 to 1, measured afterwards
9 of 64 slices go to review. 33 with IoU under 0.70 are not sent.
Real scores: SAM 2.1, run by Nitsor outside the product, on 64 slices of real industrial CT (Gruber et al., Fraunhofer EZRT, CC BY 4.0 (opens in a new tab), modified: scored by Nitsor). Uncertainty is one minus the model's own predicted IoU, not a calibrated probability.
Uncertainty-routed review
Review work above your threshold.
Set the uncertainty score that sends work to review. The score is the model's own, and nothing calibrates it. Each task keeps its routing rule and result.
One gate decision
- Gate
- uncertainty-above
- Threshold
- 0.074
- Slice 328
- uncertainty 0.0751, sent on
- Model
- SAM 2.1 hiera-tiny, recorded run
What gets written down: the gate, the threshold and the work's uncertainty. The model and slice are from the run above. The hosted model is SAM 2.1 hiera large.
Recorded when a gate keeps a task out of review
- Task
- label-0142, completed at Annotate
- Gate
- uncertainty-above, threshold 0.40
- Uncertainty
- 0.31
- Result
- no review task created
- Code
- workflow_router_
gate_declined - Shown as
- This task's uncertainty was 31% and the gate only sends on work above 40%, so it finished here.
Worked routing example. The task, threshold and score are examples; the code and refusal sentence are the product's own.
See why a task skipped review.
Open the project overview to see why no review task was created. A routing decision does not mark a label as accepted.
Choose how much work reaches review.
Lower the threshold to send more tasks to reviewers. Raise it to send fewer.
The model's uncertainty, the queue's sort key
IoU with the published label, measured afterwards; the queue never sees it. Lighter bars, under the line: IoU under 0.70, a miss.
The 64 recorded scores from the threshold figure near the top of the page, sorted the way a review queue set to most uncertain first takes them. SAM 2.1, run by Nitsor outside the product on real industrial CT (Gruber et al., Fraunhofer EZRT, CC BY 4.0 (opens in a new tab), modified: scored by Nitsor).
Most uncertain first.
Sort the review queue so reviewers see the work the model is least sure of first. Most of its misses come early, but not all of them.
What the order puts first
- Queue order
- uncertainty-desc, most uncertain first
- First 10
- 9 miss the published label (IoU under 0.70)
- All misses
- 42 of 64 slices
- Second half
- 17 misses, where the model is most sure
Counted from the 64 recorded scores, sorted under the product's uncertainty-desc rule.

What each frame shows
- The queue lists the tasks you hold
- The task opens in the editor for review
- Three labels wait for a verdict
Real chest CT: Armato et al., "Data From LIDC-IDRI", TCIA, CC BY 3.0 (opens in a new tab), modified: cropped. Labels from the LIDC readers' published annotations.
Open a review task from your queue.
Your queue lists the tasks you hold. Open one and the editor shows the labels waiting for your verdict.
V5 slice 328
Two scores over slices 300 to 363
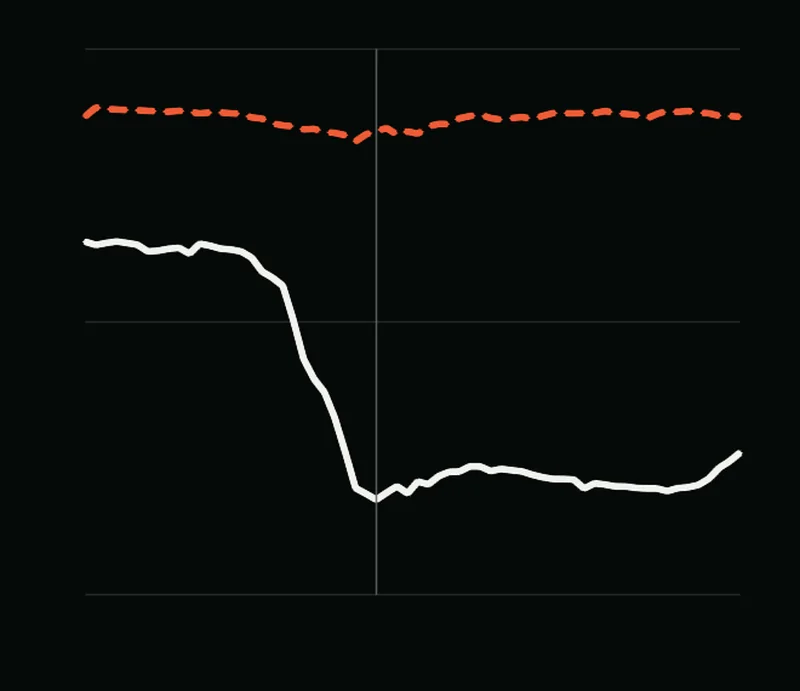


SAM 2.1 run by Nitsor outside the product on 64 slices of real industrial CT: its own score (dashed) stays between 0.915 and 0.947 while its IoU with the published label (white) falls to 0.587. Gruber et al., Fraunhofer EZRT, CC BY 4.0 (opens in a new tab), modified: windowed, cropped and outlined by Nitsor. Sources
Sample confident output for missed errors.
Confidence can hide mistakes. A sampling rule sends a share of model output to reviewers, including low-uncertainty work.
A sample-rate gate
- Gate
- sample, 5%
- Picked by
- a stable hash, so a replay routes the same way
- Slice 340
- uncertainty 0.065, IoU with the label 0.62
- Routed
- sent to a person by the sample
Worked routing example. The sample rate and routing result illustrate the rule; the two scores are from the recorded SAM 2.1 run above.
Set thresholds on your own scans and your own reviewers' verdicts.
Four readers, published
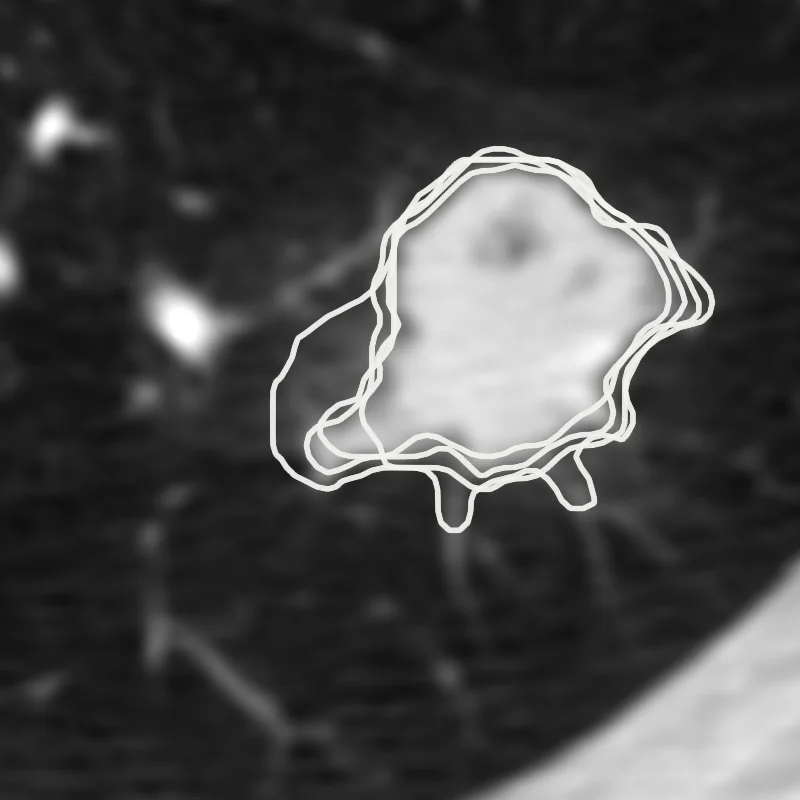
Where they agree
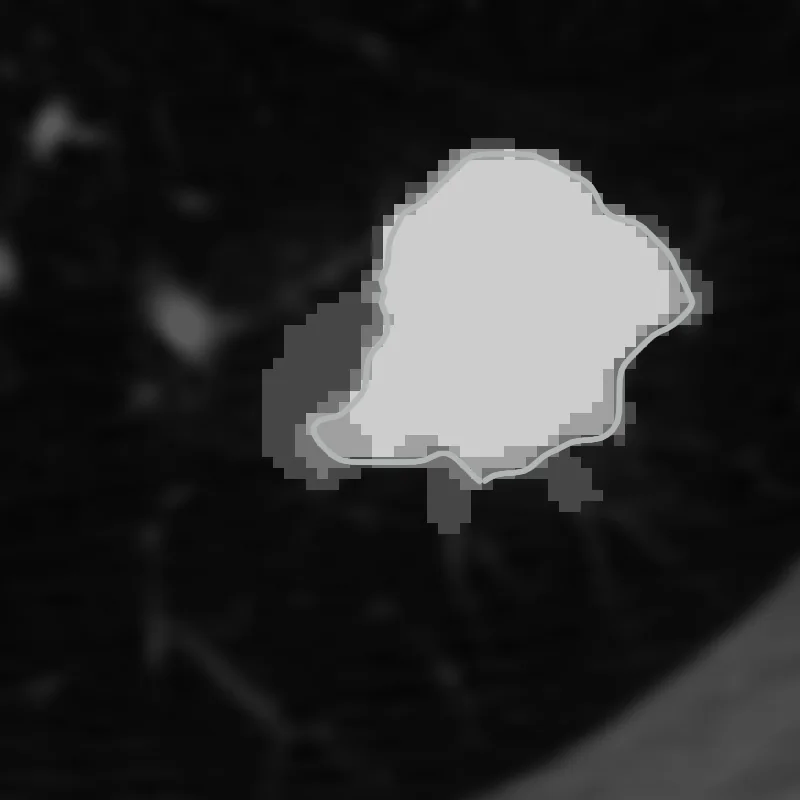
Pixels covered by 1, 2, 3 and 4 readers: 168, 81, 84 and 547. Lighter grey, more readers.
SAM 2.1 against 3 of 4
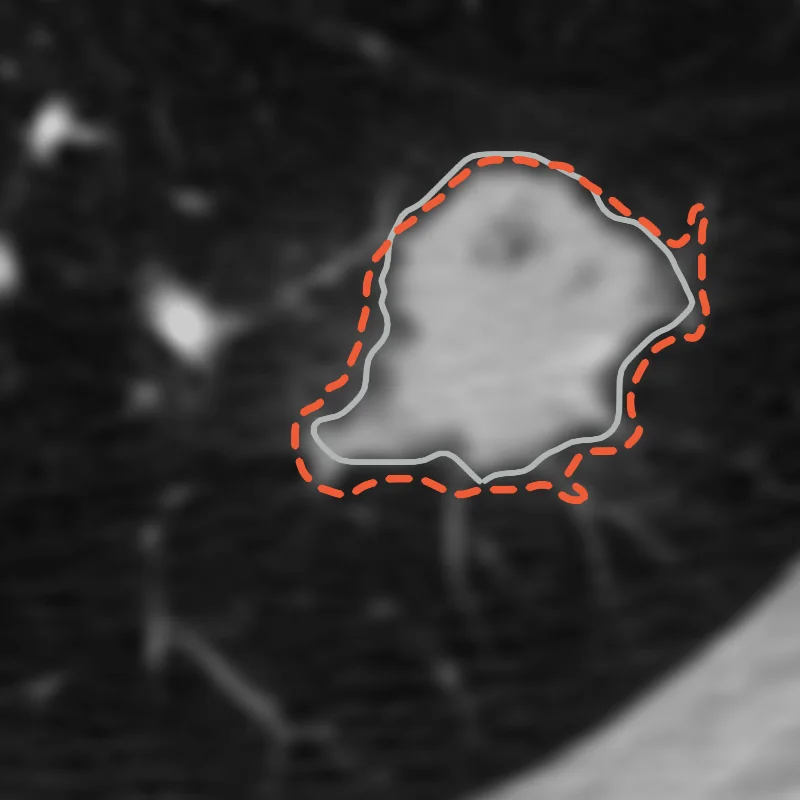
IoU 0.81 with the 3-of-4 outline; 0.79, 0.80, 0.84 and 0.84 with readers 1 to 4.


One nodule on slice 64 of a real chest CT, LIDC-IDRI-0003. White: the outlines of LIDC's four readers, as published, kept apart. Grey: where they agree, and the outline of at least 3 of 4; both are derived from the four published outlines by Nitsor outside the product. Dashed: SAM 2.1's proposal from a run recorded by Nitsor. Armato et al., "Data From LIDC-IDRI", TCIA, CC BY 3.0 (opens in a new tab), modified: windowed, cropped and outlined by Nitsor. Sources
Several readers, one decision.
Send the same study to 2 to 16 readers for a second read. Each reads it blind, Nitsor scores where they agree, and a disagreement goes to an adjudicator.
A consensus read, as your team sets it
- Readers
- 4, blind to each other by default
- Reading
- independent reads, or check and correct
- Agreement
- Dice or IoU for masks, mm for points, exact match per field
- Criteria
- Dice 0.80 or more for masks, within 2 mm for points
- Adjudicator
- A. Rivera
- Disagreement
- the adjudicator takes a reader's labels, keeps the original or edits their own
- On record
- each read, score and decision, in History and the API
Worked review example. Names and decisions illustrate the workflow; the outlines are LIDC's published ones. Your team sets its own criteria.

What each frame shows
- Returned work comes with the reviewer's reason
- The returned label, on its slice
- Erase it on this slice
- Paint it back inside the edge
- The review Task is back in the Queue
Real chest CT: Armato et al., "Data From LIDC-IDRI", TCIA, CC BY 3.0 (opens in a new tab), modified: cropped. Labels from the LIDC readers' published annotations.
Return rejected work with its reason.
Rejected work can be sent back with the reviewer's note. Corrections follow the configured workflow.
Show us what you inspect.
Start with a public CT or MRI scan. See how a model suggestion becomes a reviewed label and a fixed training dataset.